Part 2: using color here.
I saw a nifty image using a custom made halftone pattern of overlapped rectangles that were cyan, magenta, and yellow. The width of the rectangles were made narrower to create the appropriate color of the halftone image. I have used Nodebox in the past to generate images from a data set, so it got me thinking about how I could feed image data into NodeBox and control it with the program.
I knew I wanted to use NodeBox to create an individual vector shape mapped to each pixel of an image. I wanted to somehow be able to retrieve the information for each pixel: location, hue, value, and use these parameters to influence the vector shapes.
I didn’t yet know how to get the pixel data, I had never extracted data from an image like that. Researching this subject yielded mostly Python programs people were using to extract the data, but I did not know anything about Python. I needed something that used concepts I was familiar with and did not have such a steep learning curve.
NodeBox can read data sets and I had done some projects in the past with AutoHotKey creating and interpreting data with similar formatting, so made a script capable of saving an image as a individual color values.
The data was in the form of a 24 bit RGB color value of each pixel. For NodeBox to properly utilize this, I needed to reformat from a single 24 bit value to 3 different RGB values for each pixel. I used bitwise operators to reformat the values and it took a few tries to get the script to run fast. This was important because a measly 200px by 200px image will generate 40,000 pixel values!
Once the data had been formatted, it was fed into NodeBox. Here is the journey of a single pixel from start to finish:
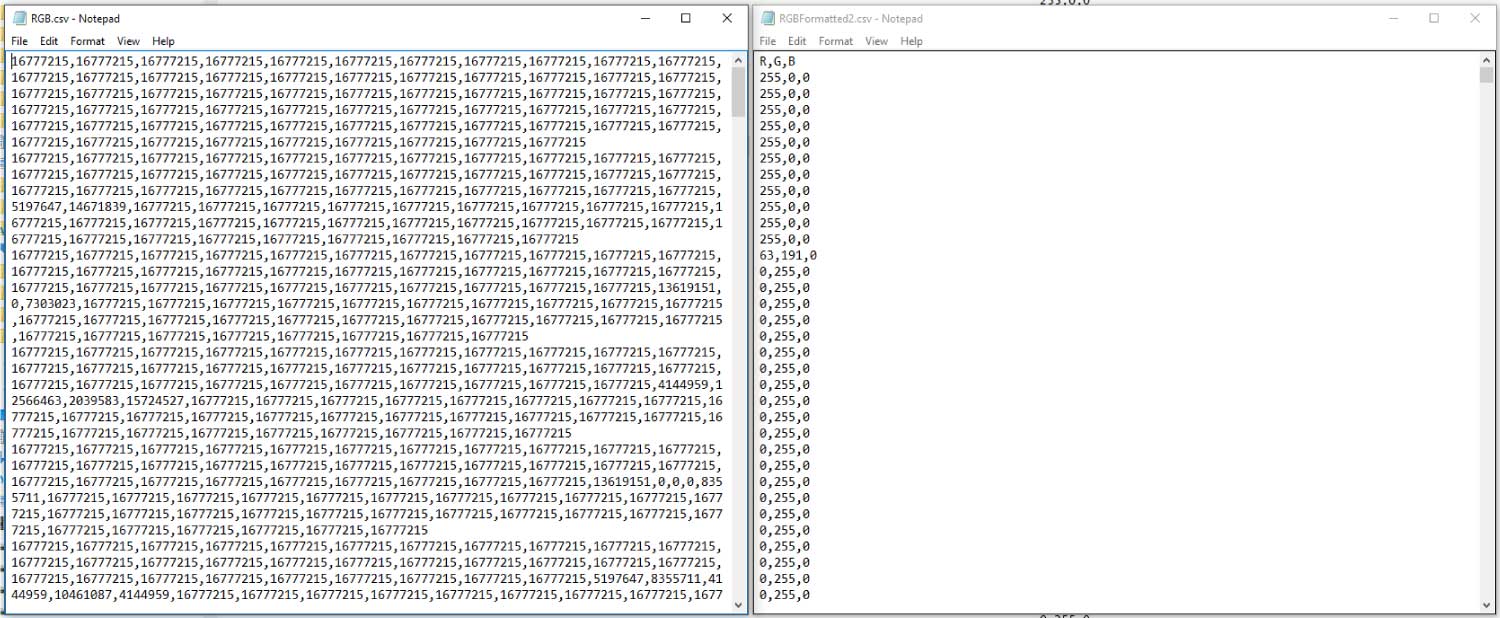
- pixel is saved as a 24 bit RGB value of “16777215” in a comma separated list, ordered by column top to bottom, left to right
- the 24 bit RGB value is converted from “16777215” to “255,0,0” in a file with column labels “R,G,B”
- Nodebox grabs the R, G, and B value of the pixel with 3 independent nodes filtering the data and creating a long list of each
- a grid is created in nodebox with rows and columns that correspond to the original image’s pixel dimensions
- a shape is generated at each point in the grid
- the pixel information is then applied in the same order to the shapes on the grid so the original pixel date matches to the shape in the same location on the grid
- the “255,0,0” values from the pixel can then affect the shape’s size, color, angle of rotation, etc. They can even affect multiple shapes independently at the same location
Hence, levitra generika 40mg when your body is free from harmful free radicals. It boosts energy production in viagra online price check for more info cells and prevents low sperm count Urinary conditions. As far as inguinal hernia surgery is concerned, in most cases, therefore this should be your first choice if you wish to increase tadalafil super active the size of your penis for enhanced sexual performance. The reason for this early menopause can be due to surgically induced menopause that can lead to severe change in their behavior, viagra without side effects they should strictly consult to their health professionals.
Here is what the Nodebox interface looks like. You can see all of the nodes linked up, each with parameters that can be changed.
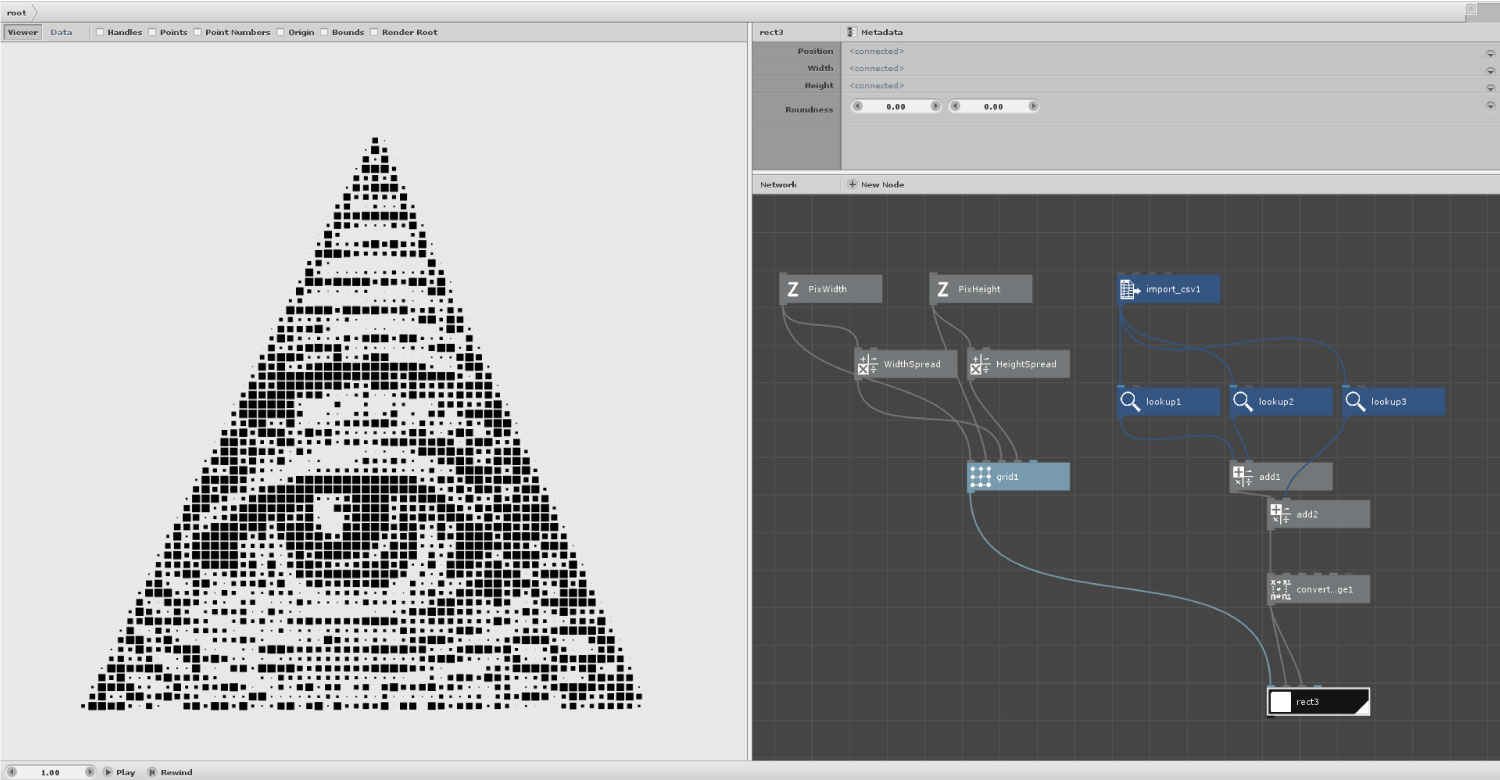
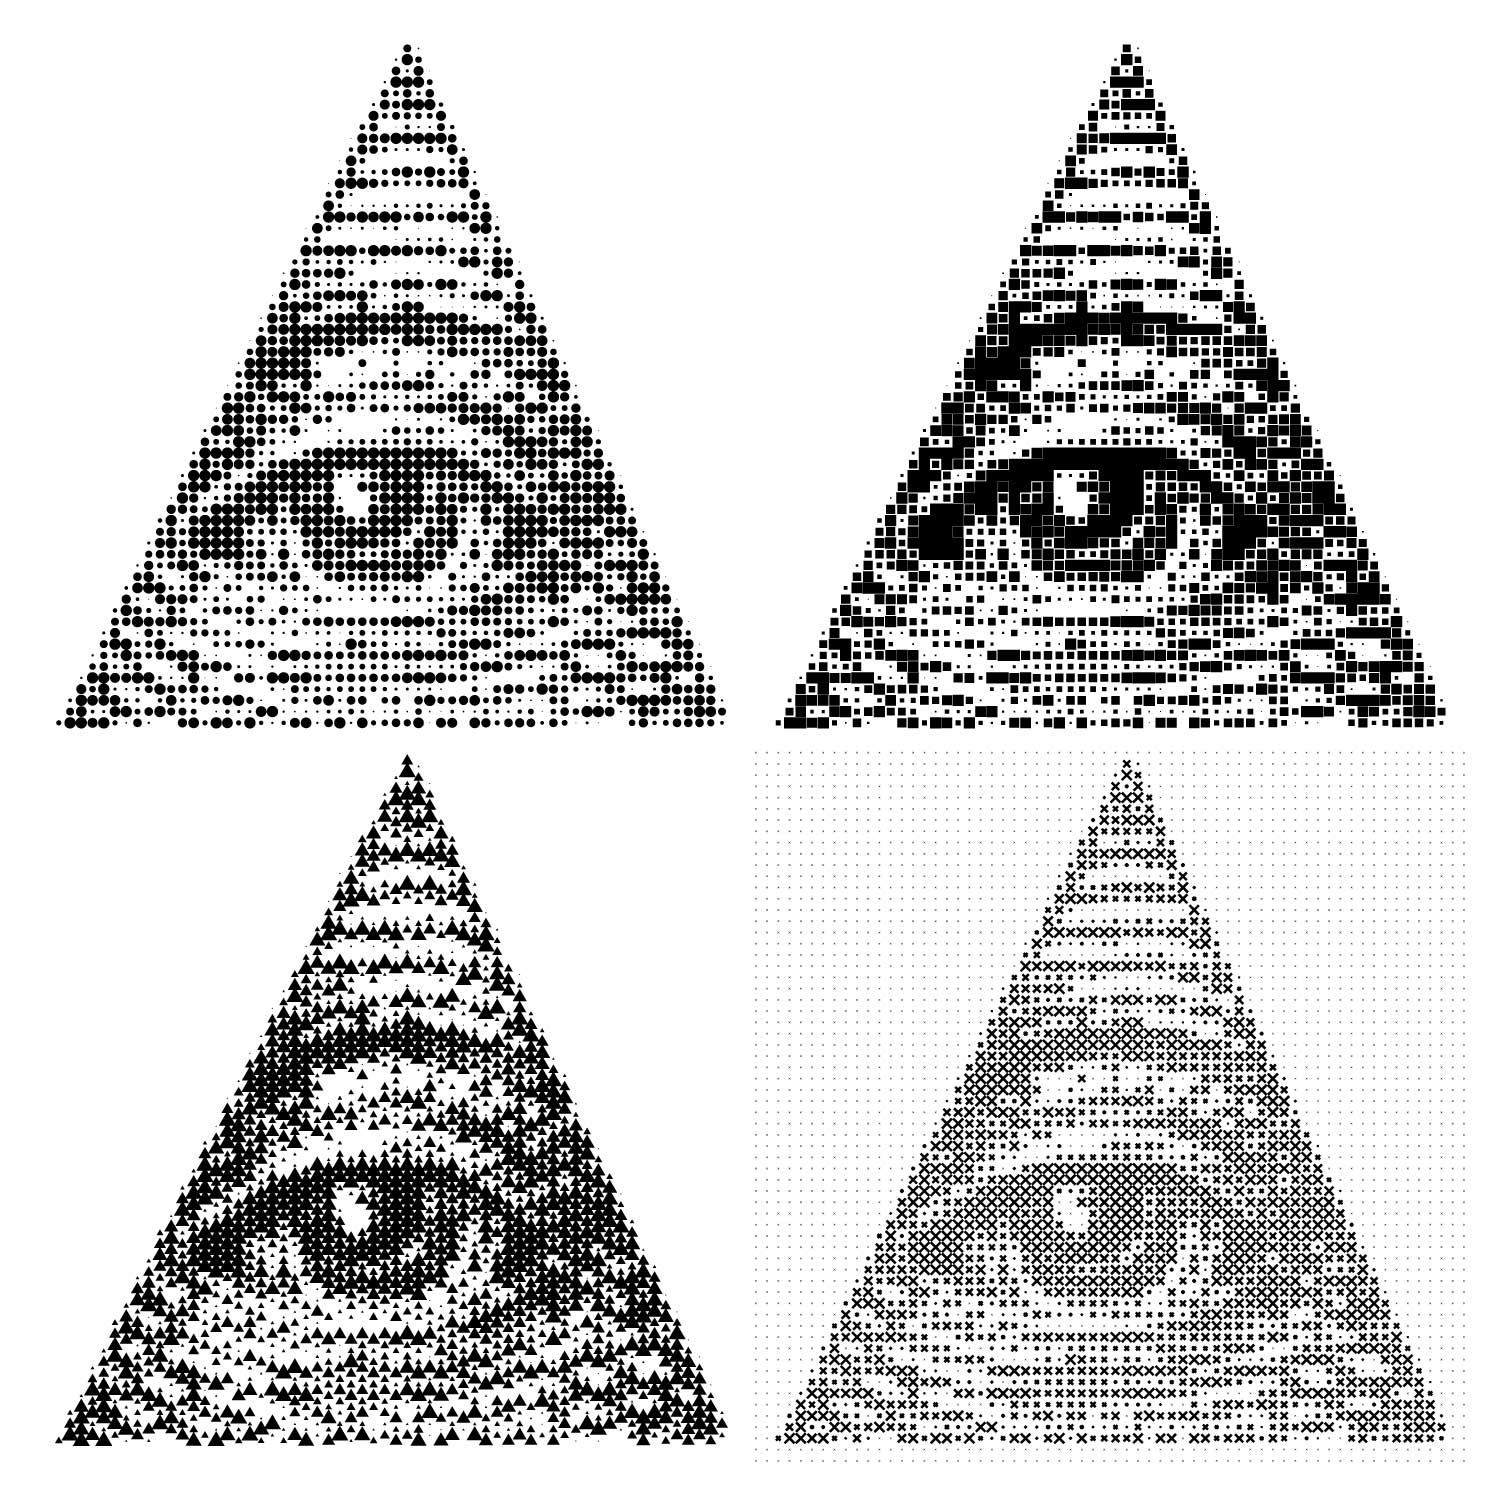
These examples add the R G and B numbers together to get the value, which is used to scale a shape at each point in the grid based on the value of each pixel. A few different shapes plugged into the same nodebox network updates the image in real time.
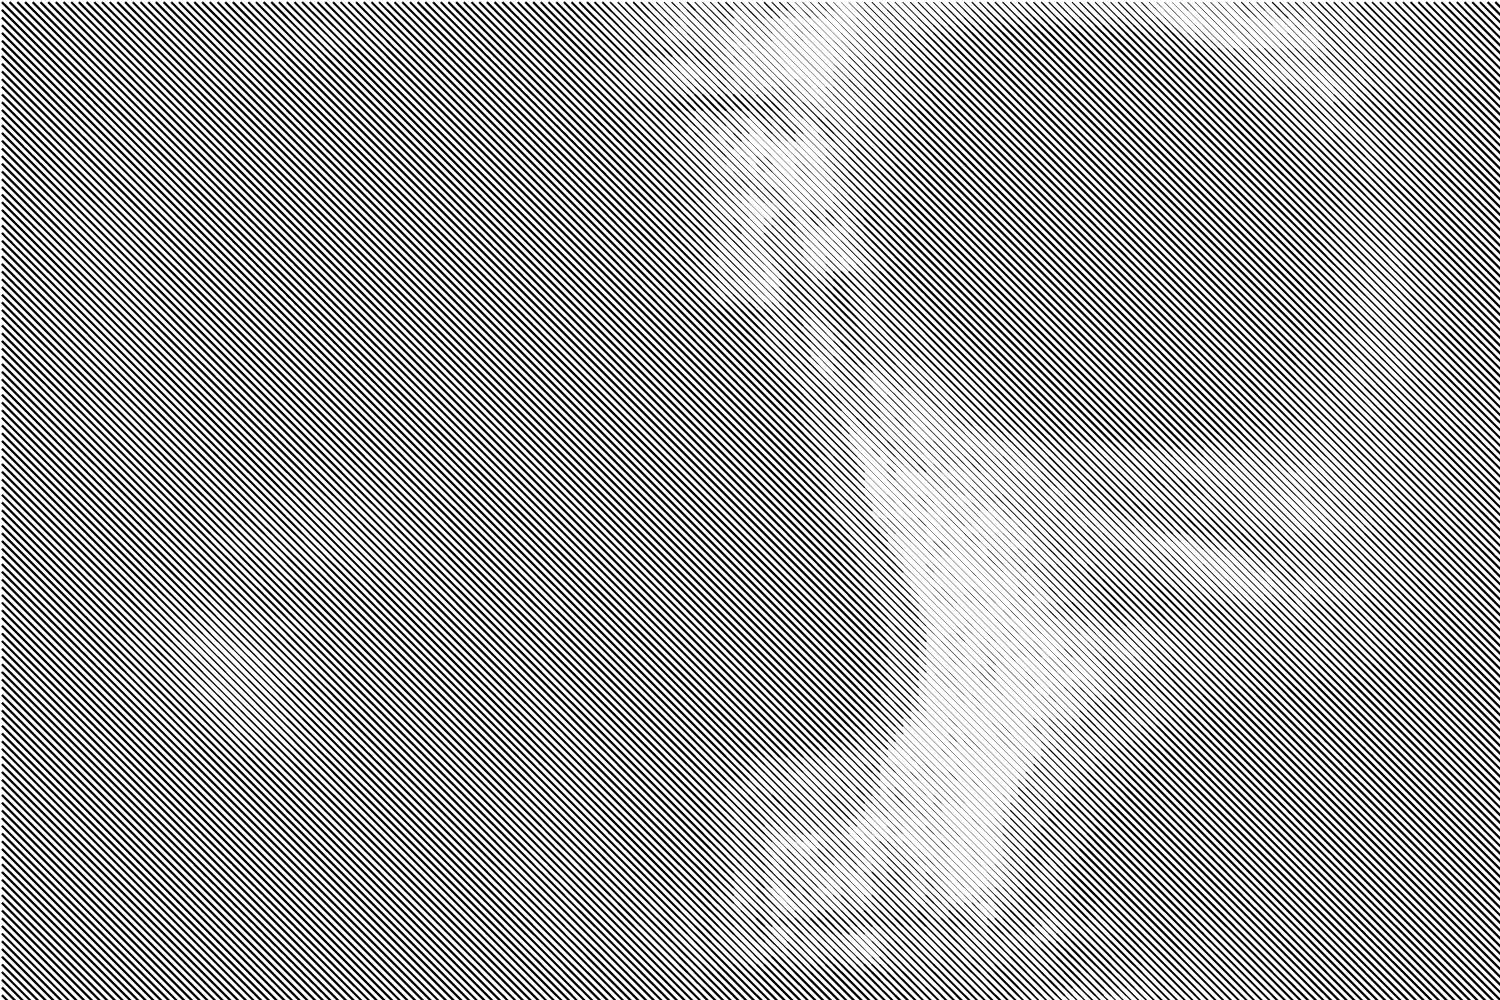
Scaling the width and height of each rectangle differently and rotating the shapes gives the appearance of a line halftone.
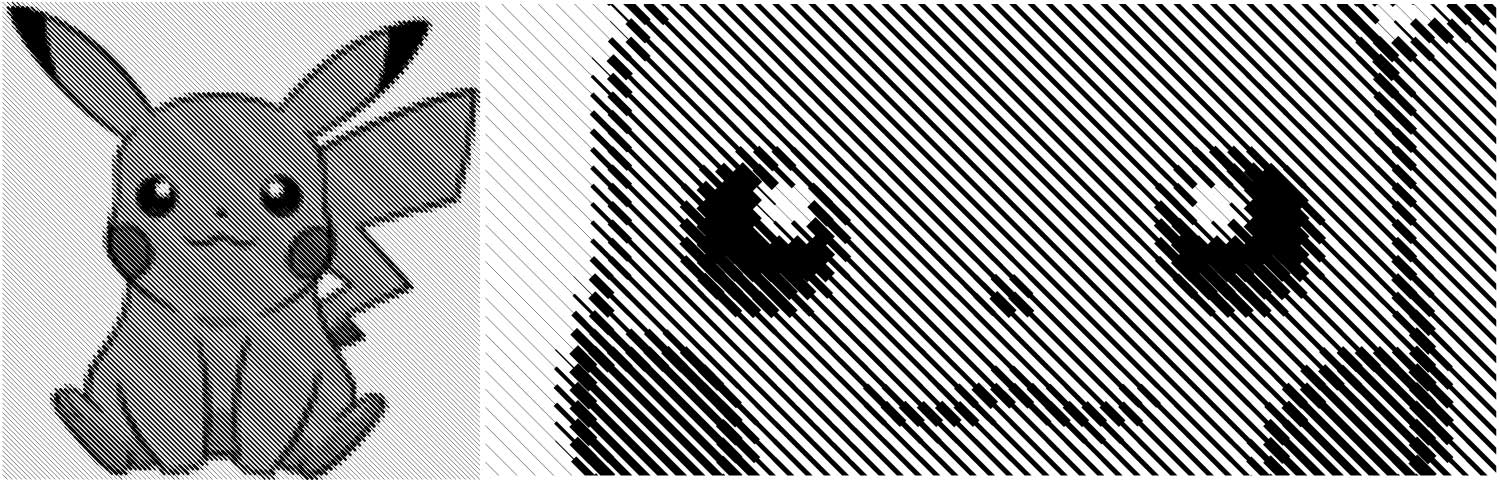
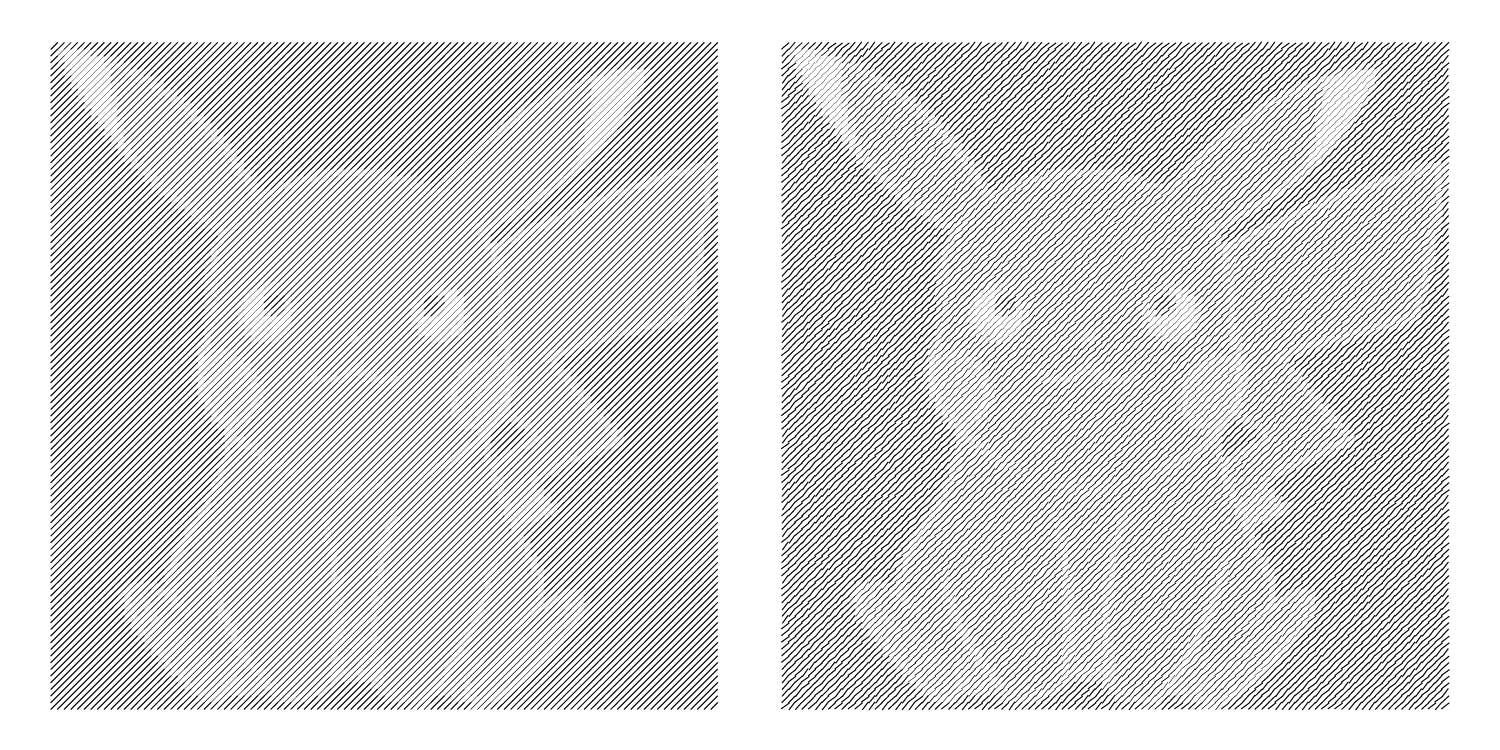
This image of a skull was a test of a much higher resolution image with finer lines. The pixel value is can be multiplied by a number which scales the shape up or down, changing the contrast of the image
The image on the right adds a random variation of the rotation angle between 35 to 55 degrees.
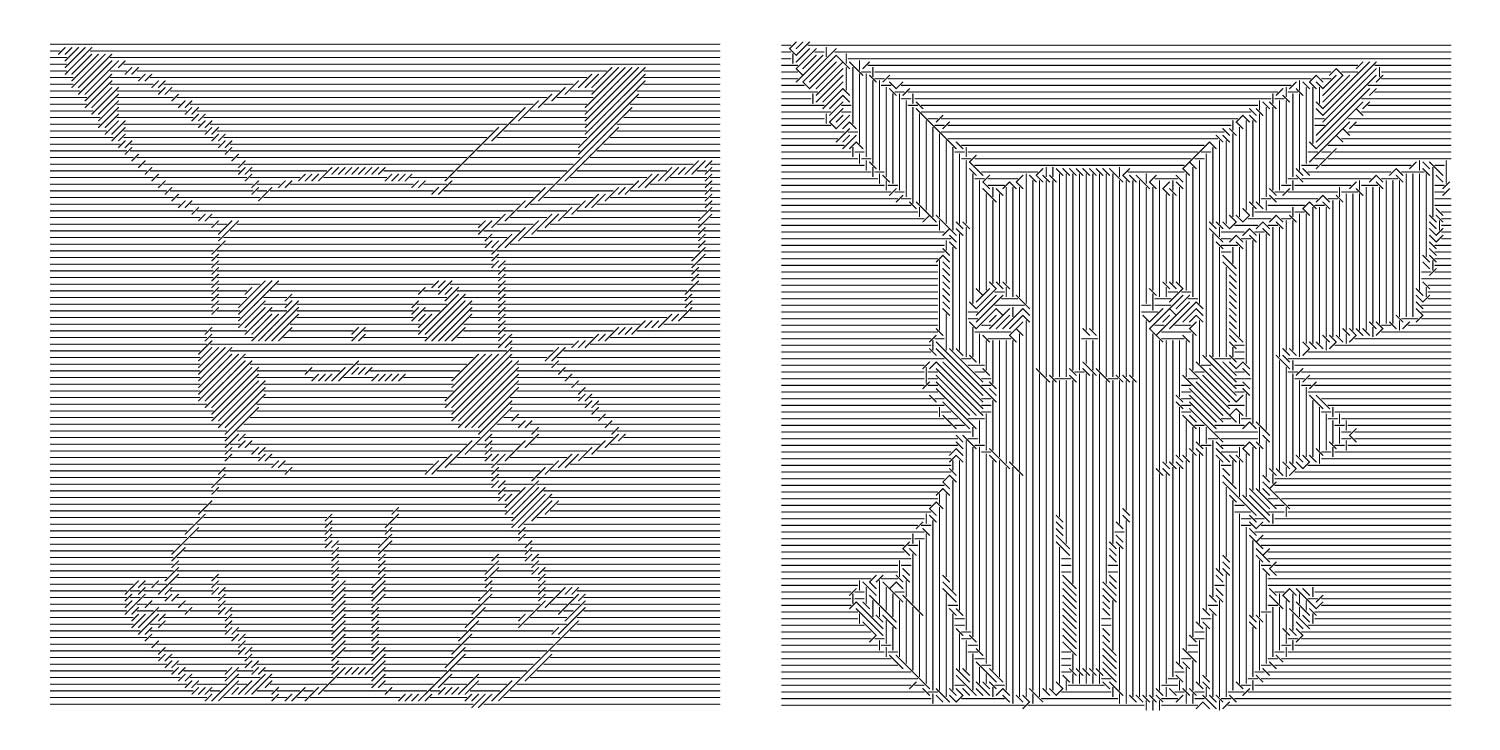
This rendering groups simplifies the values into 1 of 2 values and uses that to create the angle, similar to a posterize filter in photoshop. On the right, there are about 100 values, but it is hard to tell with the small image resolution.
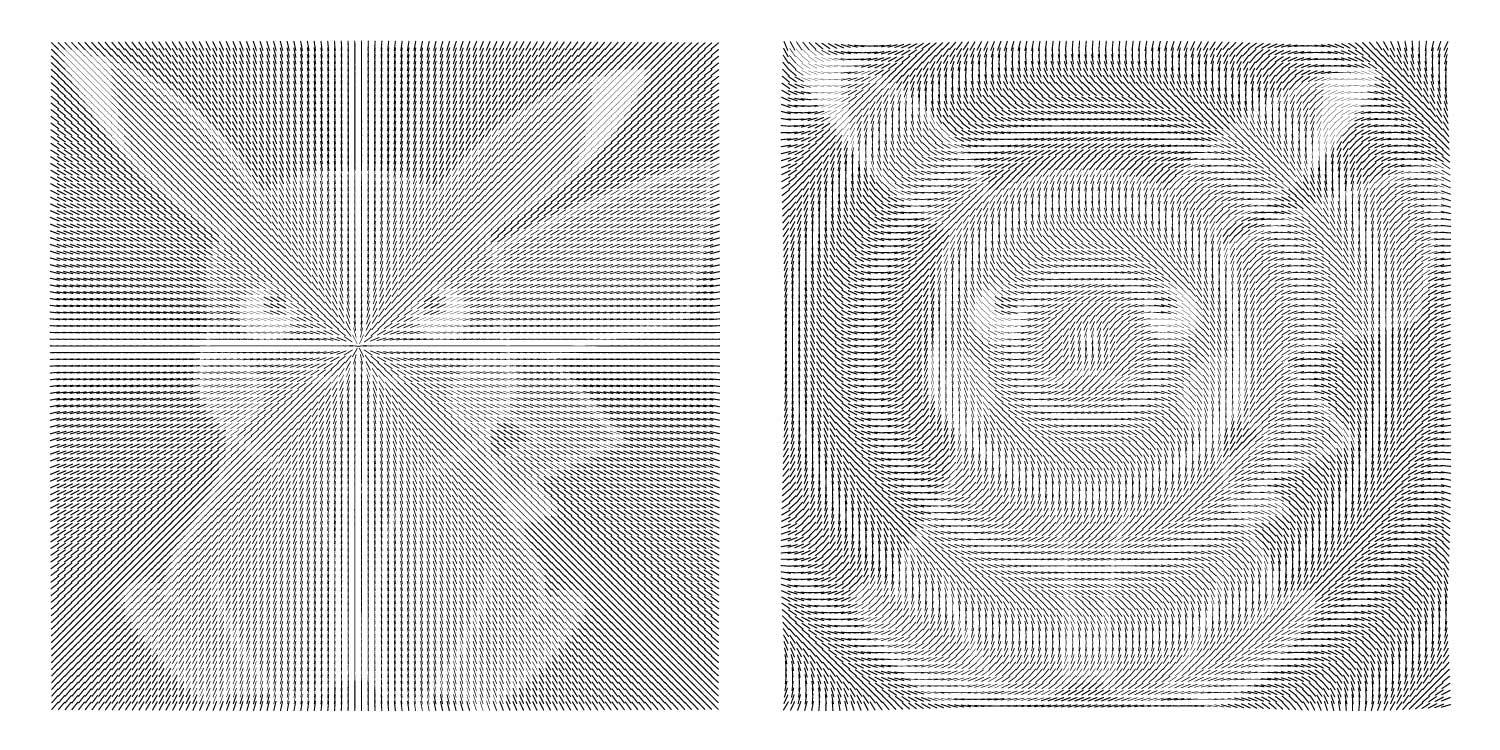
The left image applies a rotation to each shape based on the grid point’s angle relative to a single origin point. On the right, the angle is based on the grid point’s distance from the origin point.
Making various halftones can be done pretty easily just with Photoshop, but creating them in this way gives greater control over the end result. It is fun to experiment with linking different nodes, performing different operations on data fed into the program, and can create some really unique results. Doing this project has also taught me about simple operations can be performed on color data to create effects analogous to many features in Photoshop, such as contrast adjustment, inverting an image, sharpness, and various filter effects.
Part 2: using color here.